FRDM-K22F: Debugging with External Segger J-Link Debugger
This article explains how you can connect and debug the FRDM-K22F board with an external Segger J-Link debugger.
1. Disconnect J10 and J13
From the FRDM-K22F Freedom board for Kinetis K22 Hardware document Section 13, it points out that
The debug interface on the MK22FN512VDC12 MCU is a serial wire debug (SWD) port with trace output capability. There are two debug interfaces on the FRDM-K22F: an onboard OpenSDAv2 circuit (J5) and a K22F direct SWD connection via a 10-pin header (J11).To use an external debugger, such as J-Link on J11, you may need to disconnect the OpenSDAv2 SWD circuit from the K22F by removing jumpers J10 and J13.
Therefore, to use with external J-Link debugger, we need to disconnect the J10 and J13 jumpers to disable the on-board OpenSDA debugging functionality, but instead allowing external connections.
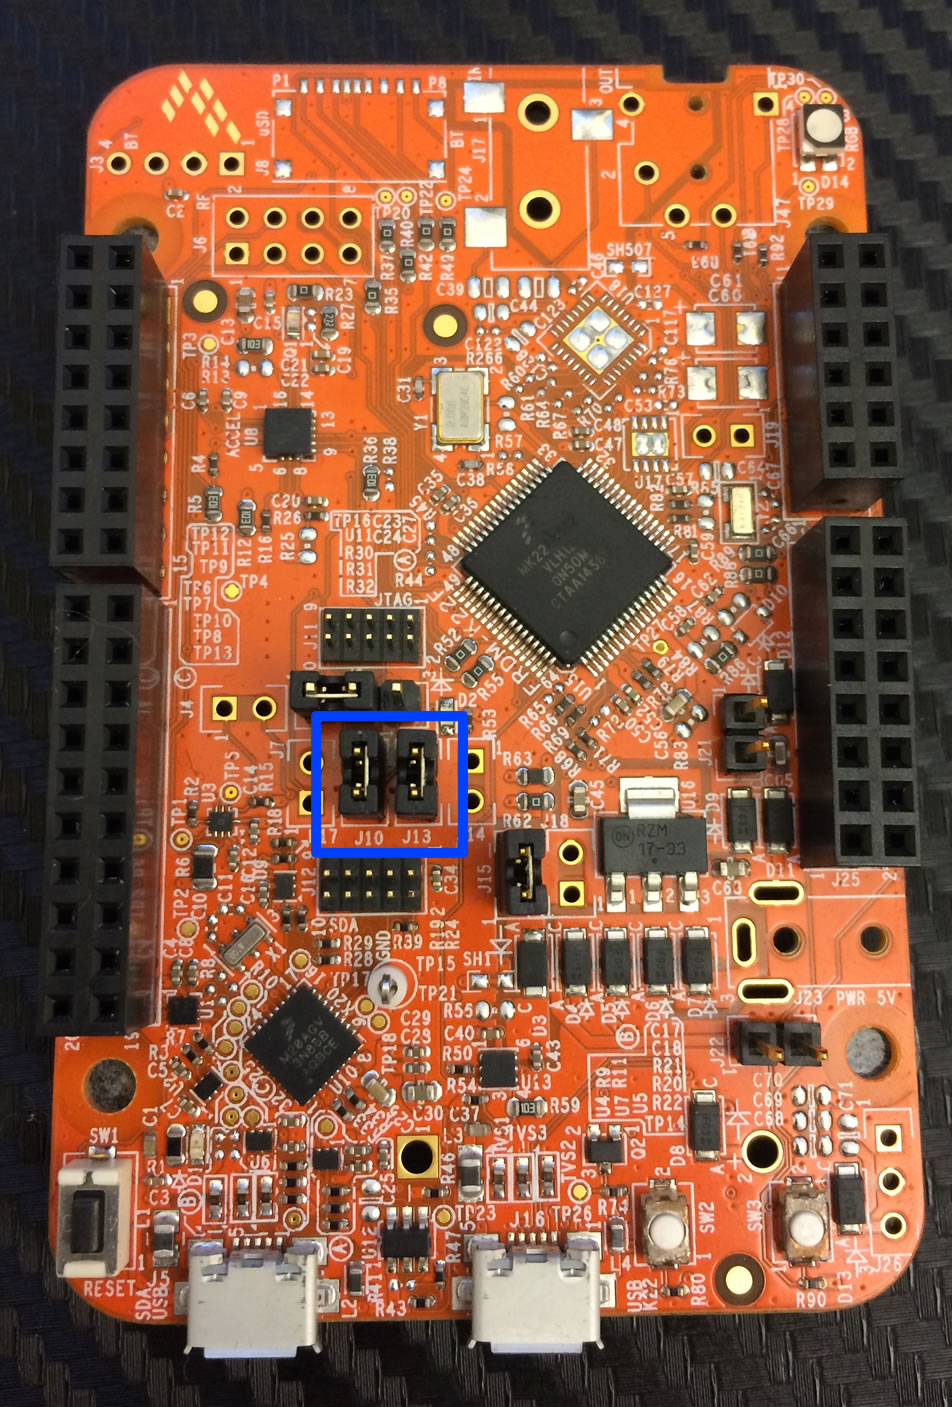
On the board we can find the two jumpers J10 and J13 connected by two jumper shunts.
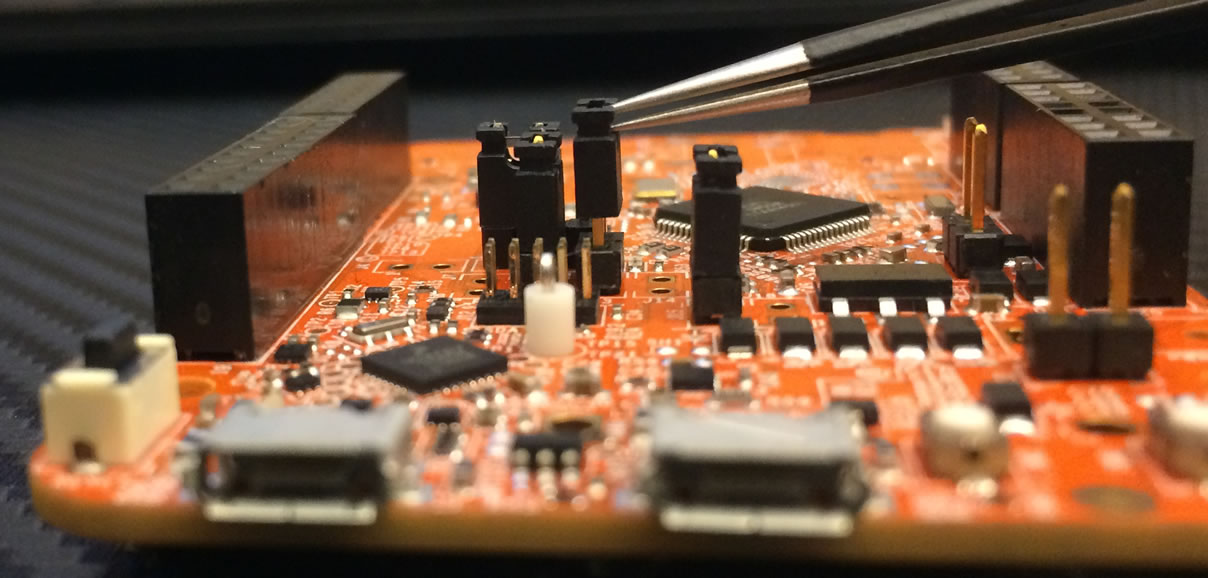
We can simply unplug the jumper shunts to disconnect J10 and J13.
2. Connect J-Link to K22F SWD Debug Interface
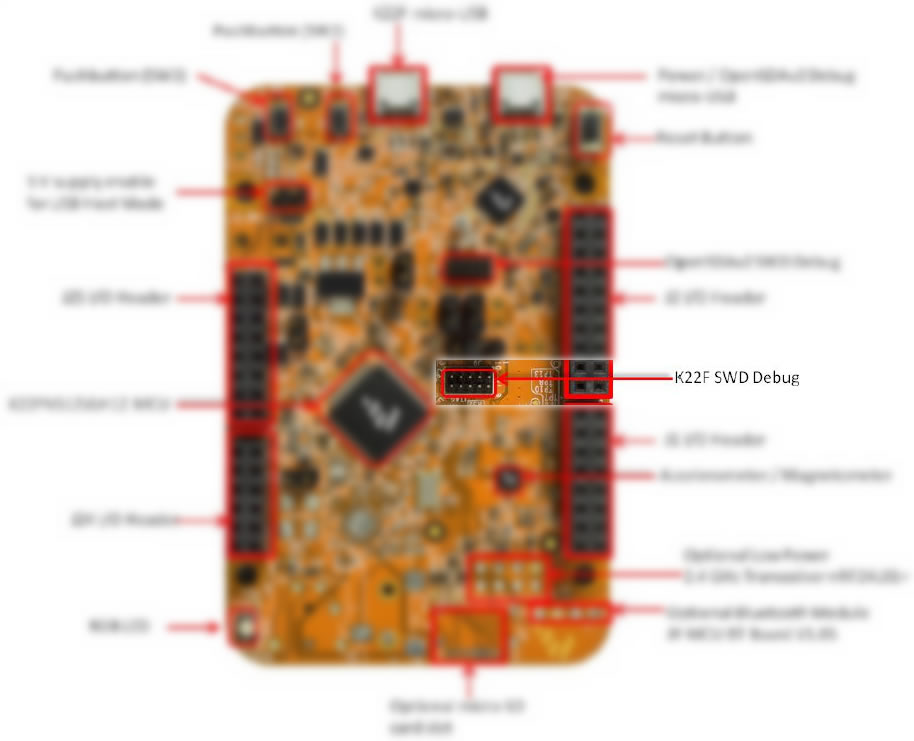
From the FRDM-K22F Quick Start Guide pg.2, we can find out the SWD interfaced located on the board.
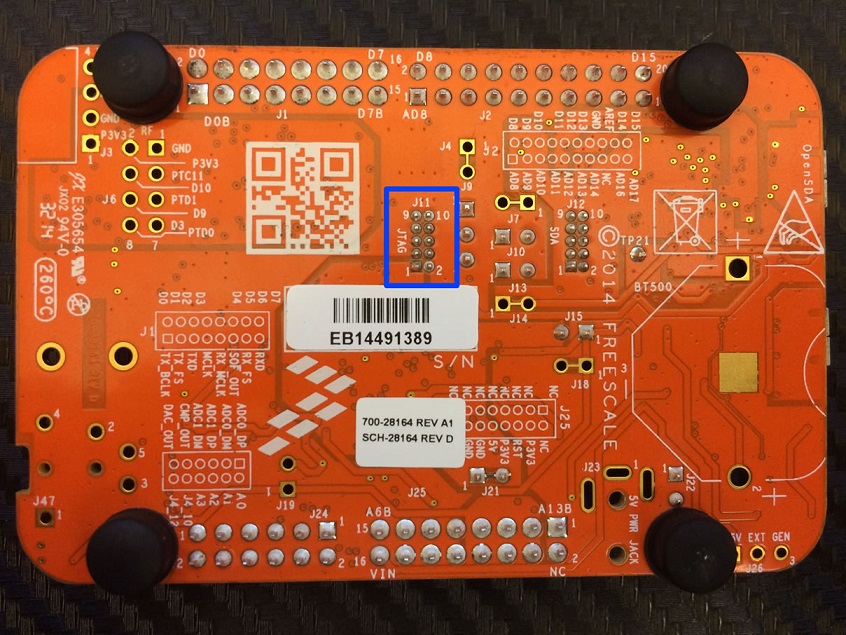
And then, on the bottom side of the board, we can find out the pin numbering of the SWD interface.
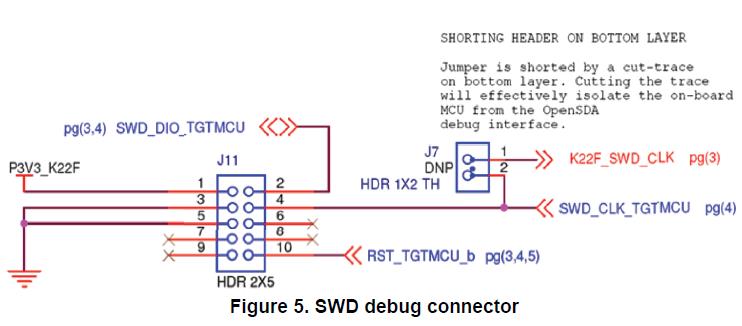
From the FRDM-K22F Freedom board for Kinetis K22 Hardware document Section 3.2.1 we can find out the pin assignment schematic of the SWD interface.
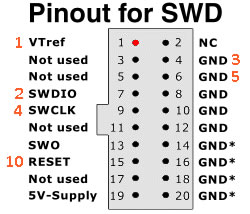
So here is the pin assignment for J-Link SWD connection port, numbers in orange are the pin numbers of the SWD interface on the FRDM-K22F board.
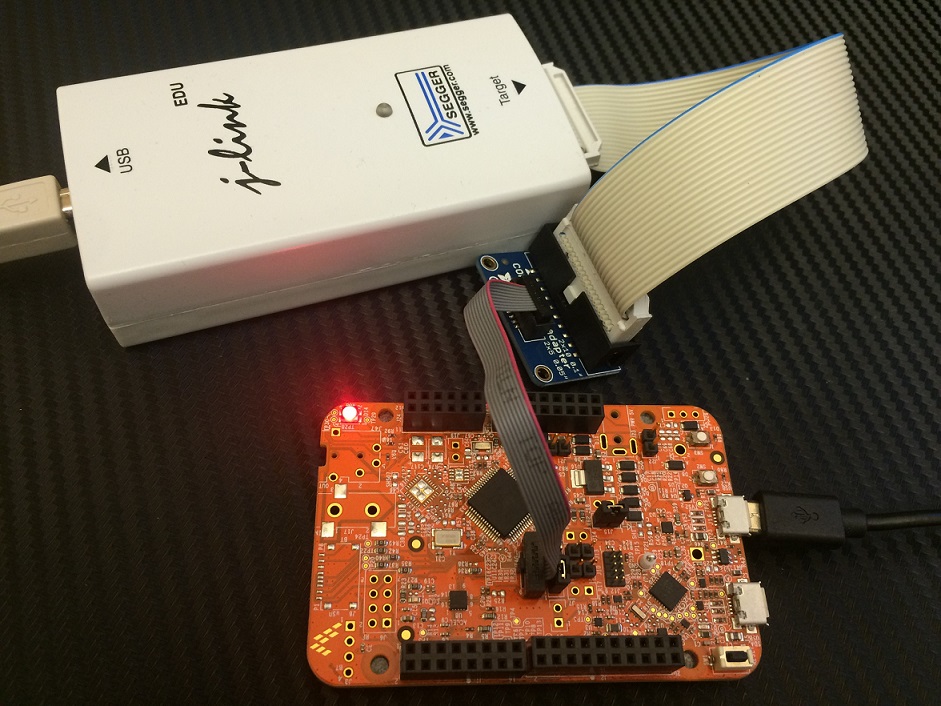
You can connect these pins manually to your J-Link debugger, but the simplest way is to buy this J-Link adapter to connect them directly.
Just be careful at the direction of the connector plugging on the board as there's no indication slot for you.
3. Debugging with J-Link Debugger
Now plugin your J-Link device to your computer, and launch the J-Link Debugger program.
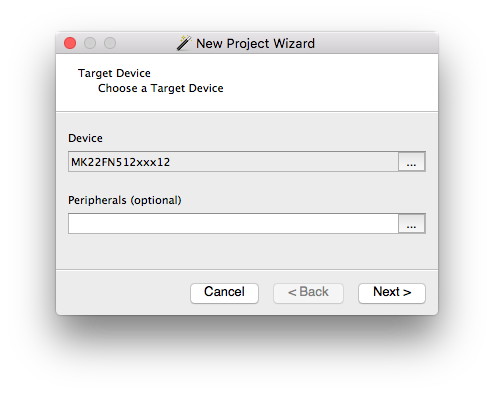
In the new project wizard window, click the "..." button under "Device" option.
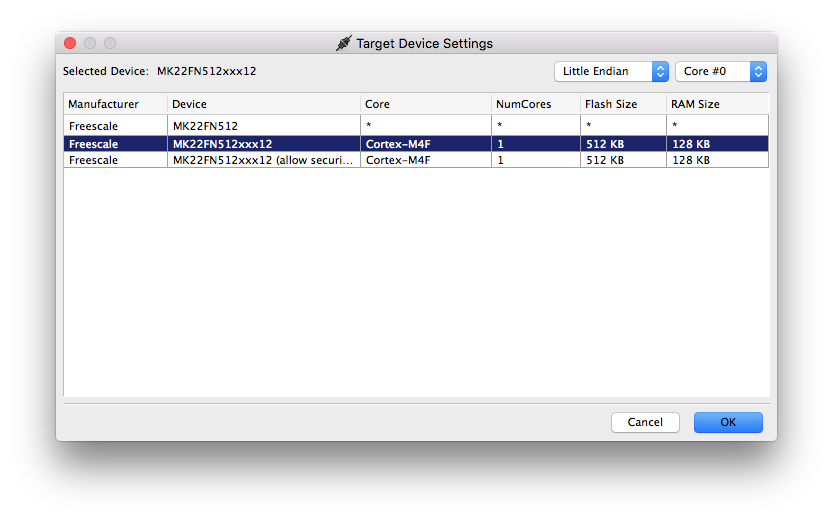
In the popped up window, search and select Freescale MK22FN512xxx12 then click "OK". Then click "Next".
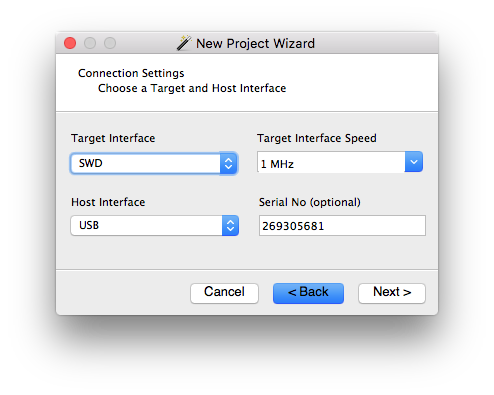
In the Connection Setting window, select Target Interface as SWD. Type your J-Link device's Serial No which you can find on the bottom of the device. Then click "Next".
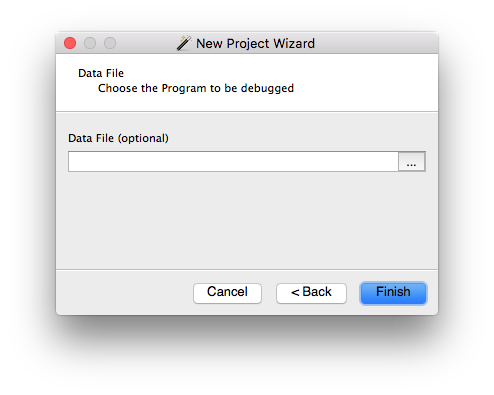
Click "Finish".
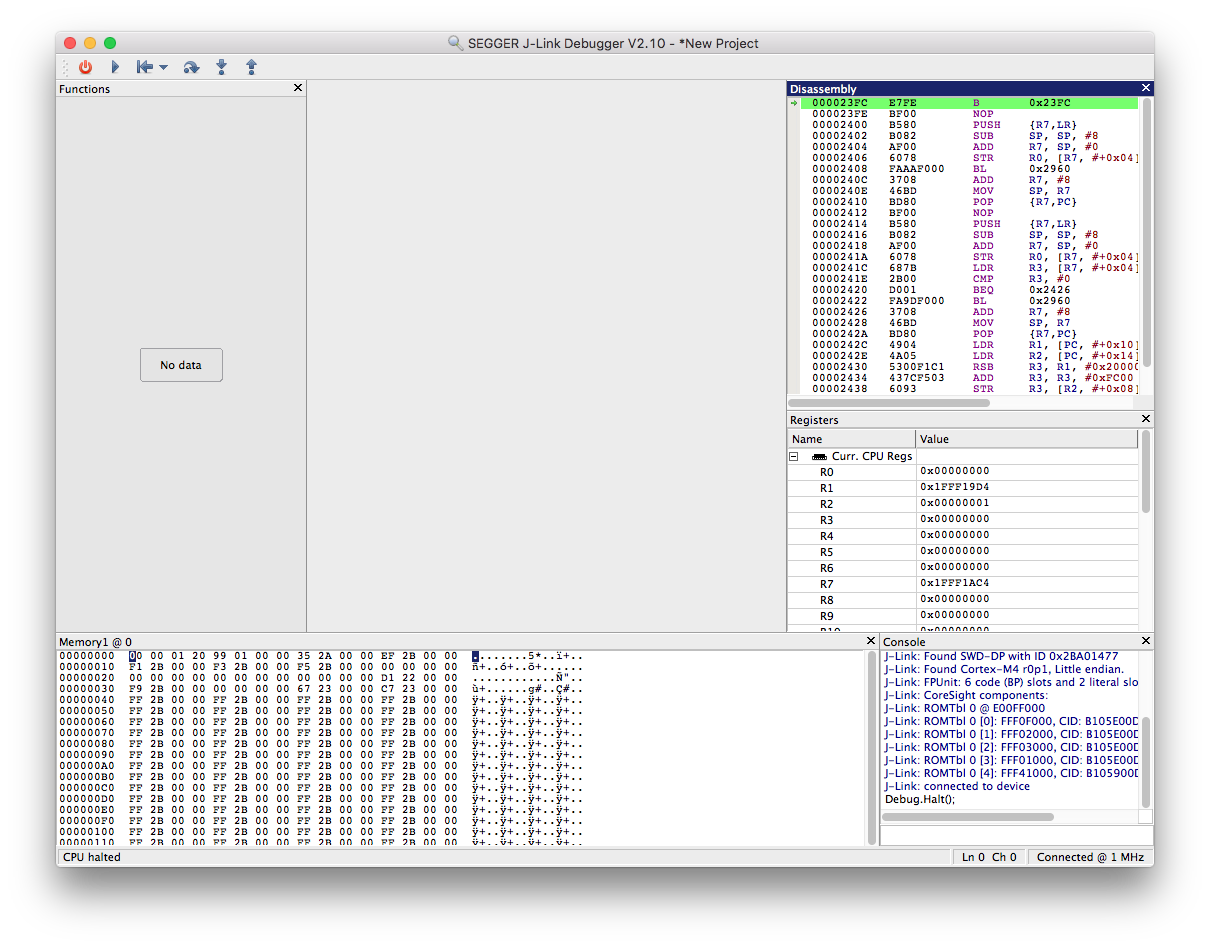
Now you have successfully connected your FRDM-K22F board with an external Segger J-Link debugger. Try load a program and start debugging.